The Extra Point How NFL teams use the game clock – and what it says about late-game strategy
December 16, 2021
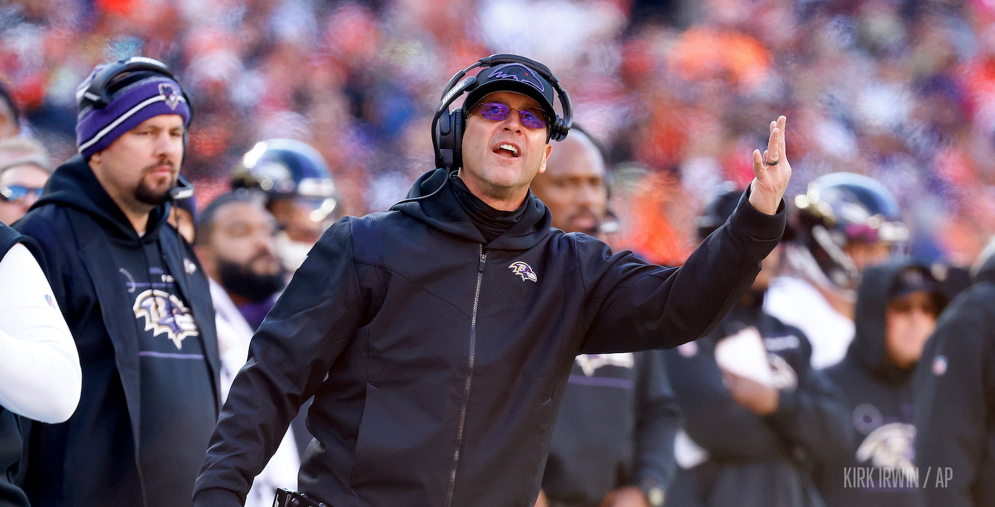
In a Week 14 matchup with the Cleveland Browns, the Baltimore Ravens scored a touchdown to cut Cleveland’s lead to nine. Ravens head coach John Harbaugh decided to attempt a two-point conversion to try and trim the lead to seven. The Ravens failed to convert and eventually lost 24-22.
Harbaugh offered an explanation for his aggressive end-of-game strategy, but not everyone supported his reasoning to go for two.
“If you’re down two scores, the other team will change their play calling, and how they direct the game,” said a skeptical Phil Simms on CBS Sports’ “Inside the NFL.” “We don’t put that into the analytics.”
To assess if the play-calling aspect of Simms’ argument was accurate, the NFL Football Operations team looked at the run vs pass rates on all first down plays from 2006-21 (using plays before a team reaches field goal range), and split by game minute and score differential in the graph below.

The blue tiles correspond to game settings based on time and score where teams run more often. The red tiles represent situations in which teams tend to pass. The yellow tiles reflect situations that call for a more balanced strategy.
There are two points in games where the strategies change based on the game situation. The first change occurs during the final two minutes of the first half. Offenses pass more, throwing the ball on around 75% of first-down plays. The second change in strategy comes near the end of the third quarter, when (as is shown in this chart) strategy starts to diverge based on both time remaining and score. Teams trailing later in games tend to throw more passes, while teams leading run more. Late in games, the difference in strategy is even more dramatic: teams trailing pass the ball close to 90% of the time on first downs; and teams with the lead run the ball at a similar rate.
To better understand the setting in the Ravens-Browns game, we focus our chart only on teams in two-possession games in the fourth quarter.
We’ve added dotted lines to show games separated by one score (1-8 points) and two scores (9 or more points).

Changes in strategy appear concentrated at each of the four horizontal lines in the graph.
As Simms suggests, teams leading by two scores run the ball 10% more often (75% vs 65%) than teams up by only one score. Teams trailing by two scores are much more likely to pass (80% vs 68%) than if they’re trailing by one score. The data shows a line of demarcation where strategy changes depending on if the score is separated by one score versus two.
But bigger leads don’t just change the probability of whether an offense calls a running play versus a passing play. There’s also an inverse link between the size of a lead and offensive success.
When compared to teams trailing by one score, defenses trailing by two scores have an easier time coming up with a stop. They give up fewer average first downs (1.1 versus 1.3), force more three-and-outs (45% versus 36%), and hold offenses to shorter drives (19.9 average net yards versus 24.8). All of that also takes less time off the clock (2:22 average time of possession versus 2:36).
Therefore, in the scenario Simms identifies that the Ravens faced, there are multiple data points that support more teams going for two. If you miss and trail by nine points, you're likely to get the ball back sooner.
NFL Football Operations’ mission is to establish a culture of clarity, consistency and credibility in all aspects of the greatest game. Football is an essential piece of America’s fabric, uniting fans, players and communities with a simple yet powerful bond. We honor the game’s history while continuing to innovate and preserve the sport for future generations of fans, players, coaches, teams and officials.
© 2024 National Football League. All rights reserved.